Advancing Environmental Sustainability: IoT-Enabled Energy Optimization
- Baran Oguz
- Digitalization
- 04 Mar, 2023
In the contemporary business landscape, environmental sustainability has become a paramount concern. This project delves into a groundbreaking project that leverages the power of the Internet of Things (IoT) to significantly reduce the carbon footprint and energy costs of a company's yard operations.
Background
The client, a company with substantial ground operations, faced challenges in managing its energy consumption effectively. High energy costs and a growing environmental footprint necessitated an innovative approach to manage and optimize energy usage.
The primary goal was to harness IoT technology to gather real-time data from ground operations, analyze this data, and provide actionable insights through a dashboard. This initiative aimed to not only reduce energy costs but also minimize the company's carbon footprint.

Let's dive into the project steps now. We'll walk through each stage, giving you a behind-the-scenes look at how we put everything together. From our initial ideas to the final touches, you'll see how each step plays a crucial role in bringing our project to life.
1. Data Collection and IoT Integration
The integration of IoT sensors in our project was a critical component for achieving real-time monitoring and analysis of energy consumption and emissions. This section delves into the 'how' and 'where' of the data journey, from capture to storage.
The foremost reason for using IoT sensors was to capture real-time data. This immediate data collection is vital for understanding current operations and making timely decisions. IoT sensors offer a high level of precision and accuracy in data collection, essential for reliable analysis and insights. By deploying sensors across various points in the operational process, we could gather a comprehensive dataset, covering all critical aspects affecting energy use and emissions.
Sensors were deployed at strategic locations – on machinery, equipment, and vehicles – to capture specific data related to energy consumption, operational efficiency, and emissions.
The collected data was transmitted wirelessly to a central system. This involved setting up a network that could handle high volumes of data and ensure uninterrupted data flow. Upon reception, the data underwent initial processing. This step included filtering, cleaning, and structuring the data to prepare it for more detailed analysis.
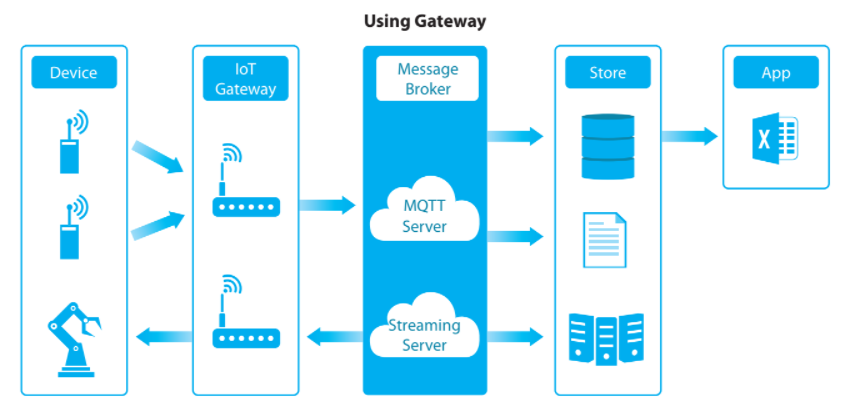
Data Storage and Management: The backbone of our data management was a relational database management system. This system was designed to handle large volumes of real-time data efficiently and securely.To enhance accessibility and scalability, we integrated cloud storage solutions. This allowed us to manage the vast data inflow and facilitated remote access for data analysis and dashboard visualization. Ensuring the security and integrity of the data was paramount. We implemented strict security measures, including data encryption and secure access protocols, to protect against unauthorized access and data breaches. Below is an example of an IoT architecture.

2. Data Processing and Analysis
The data processing and analysis phase was crucial in transforming raw data into actionable insights. This phase involved several steps and utilized specific algorithms and analytical tools.
- Data Processing:
- Normalization: The first step involved normalizing the data to ensure consistency. This included standardizing units of measure and aligning timestamps.
- Aggregation: Data from various sources was aggregated to create a comprehensive view. This was crucial for cross-referencing data points and identifying correlations.
- Data Cleansing: The data was then cleansed to remove any anomalies or errors. This step was vital to ensure the accuracy of the analysis.
- Analytical Tools and Algorithms:
- Time-Series Analysis: For understanding trends over time, we employed time-series analysis tools. This was particularly useful for monitoring energy consumption and operational efficiency.
- Machine Learning Algorithms: Advanced machine learning algorithms were utilized for pattern recognition and predictive analytics.
- Calculating CO2 Emissions:
- Emission Factors: To calculate CO2 emissions, we used emission factors, which are coefficients that quantify the emissions produced per unit of activity. These factors are typically based on the type of fuel used, machinery, and operational processes.
- CO2 Equivalent (CO2e) Calculation: The concept of CO2 equivalent (CO2e) was employed to represent the impact of different greenhouse gases in terms of the amount of CO2 that would create the same amount of warming. This involved using global warming potentials (GWPs) to convert emissions of other gases (like methane, nitrous oxide) into CO2e.
- Algorithm for CO2e Calculation: An algorithm was developed to calculate CO2e. This algorithm took into account the emission factors, operational data (such as fuel consumption, hours of operation), and the GWPs. The output was a comprehensive measure of the total greenhouse gas emissions in terms of CO2 equivalent.
3. Dashboard Development
The development of the dashboard was a crucial phase, as it served as the interface for management and operational teams to interact with the data. This phase focused on creating a user-friendly and informative dashboard.
-
Design Principles:
- User-Centric Design: The dashboard was designed with the end-user in mind, ensuring that it was intuitive and easy to navigate. This involved understanding the needs and technical expertise of the users, whether they were management-level executives or operational staff.
- Customizability and Flexibility: The dashboard was made customizable, allowing users to choose and arrange the metrics that were most relevant to them. This feature catered to the diverse needs of different teams within the organization.
- Responsive Design: Ensuring that the dashboard was accessible on various devices (like desktops, tablets, and smartphones) was crucial for on-the-go accessibility.
-
Functionality:
- Real-Time Data Visualization: One of the key features was the ability to display real-time data. This allowed users to see current operational statuses, such as energy consumption rates or emissions in real-time.
- Historical Data Analysis: The dashboard also provided access to historical data, enabling users to identify trends over time, compare different time periods, and assess the impact of changes made in operations.
- Interactive Elements: Interactive elements, such as dropdowns, sliders, and drill-down options, were included to enable users to explore the data more deeply and from different perspectives.
-
Visualization Techniques:
- Graphs and Charts: Various types of graphs and charts were used, such as bar charts for comparing data points, line graphs for trend analysis, and pie charts for showing proportions.
- Heat Maps: For quickly identifying areas of concern (like high energy usage zones), heat maps were employed.
- Custom Metrics Display: Key performance indicators (KPIs) and custom metrics, such as CO2e emissions, were prominently displayed for easy monitoring.
-
Actionable Insights:
- Alerts and Notifications: The dashboard was programmed to send alerts and notifications for specific events, like a spike in energy usage or when emissions exceeded a certain threshold.
- Recommendation Engine: Incorporating a recommendation engine that suggested actions based on data patterns helped in making proactive decisions. For example, it could suggest optimal operation times to reduce energy consumption or indicate when maintenance was needed to avoid inefficiency.
-
Integration with Decision-Making Processes:
- Reports and Exports: The ability to generate and export reports facilitated the integration of insights into decision-making processes. These reports could be used in meetings, strategy sessions, or for compliance purposes.
In light of the confidentiality constraints associated with this project, I am unable to disclose or present the final product.

4. Results and Impact:
The project's implementation led to notable improvements in both energy efficiency and environmental sustainability. The results, while more modest than initially projected, were still significant:
- Energy Cost Savings:
- Reduction in Energy Consumption: The project achieved a 10% reduction in overall energy consumption due to enhanced operational efficiencies and equipment optimization.
- Reduction in Carbon Footprint:
- Decrease in Emissions: A 15% reduction in carbon emissions was achieved, largely due to more efficient energy use and incremental shifts to cleaner energy sources.
- Operational Practice Changes:
- Adoption of New Technologies: The project encouraged the adoption of energy-efficient technologies, leading to more sustainable operational practices.
- Behavioral Changes: A shift in staff behavior was observed, with employees becoming more conscientious about energy use and its environmental impact.
- Feedback from the Company:
- Positive Reception: The company reported satisfaction with the project outcomes, appreciating the balance between cost savings and environmental stewardship.
- Policy Changes: The success of the project influenced the company's internal policies, setting new benchmarks for energy efficiency and sustainability.
- Long-Term Impact:
- Sustainable Operations: The project set a foundation for sustainable operations, with the client committed to continuing these practices.
- Influence on Industry Practices: The success story has generated interest within the industry, potentially influencing similar initiatives in other companies.
5. Conclusion:
This project stands as a testament to the transformative power of IoT technology and data analytics in driving sustainable operational practices. By integrating IoT sensors and advanced data processing, we not only achieved significant energy cost savings but also made a meaningful impact in reducing the carbon footprint.
Beyond the immediate financial and environmental benefits, the project has had a lasting influence on the company's culture and policy. It has fostered a greater awareness of energy efficiency and sustainability among staff and management alike, leading to ongoing improvements in operational practices.
Wrapping Up: Thoughts and Thanks
As we come to the end of this post, I want to extend my heartfelt gratitude to you for taking the time to read through this post.
If the insights and experiences shared in this post resonated with you, or if you have any thoughts, experiences, or questions of your own, I warmly encourage you to take contact with me. Your perspectives are highly appreciated.